No.20 Sound calibration using with calibration signal (for Microphone)
When analyzing sound signals recorded by a microphone using an analyzer such as an FFT analyzer or a Data station, the sound calibration is performed by a sound calibrator.
The REF signal of sound level meter, sensor amplifier and the sound calibrator have signals with a certain sound pressure level (114 dB, 94 dB, etc.). The sensitivity (mV/Pa) of a microphone or a sound level meter can be checked by the voltage level measured by an analyzer when the signal is input.
The sound calibration is performed before the measurement of sound so that you can check the operation of microphone, sound level meter, analyzer, and you can obtain sensitivity values that have been corrected deviations in sensitivity due to secular changes and deviations in the input characteristics of the analyzer.
If sound calibration is performed with incorrect setting or without being aware of the system fault or the cable breakage, the correct measurement may not be performed even if the value displayed looks correct.
Here are a few incorrect sound calibration examples.
The correct calibration signal
The example of connection between a measurement microphone and an analyzer as shown in Figure 1.
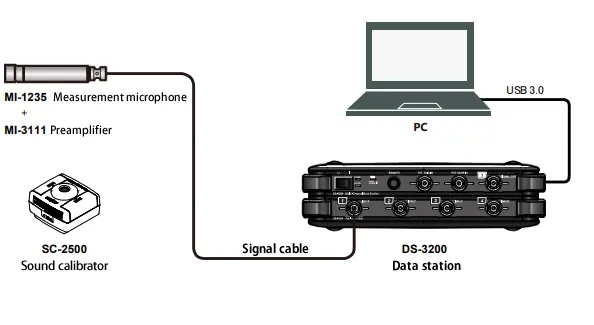
Figure1.The example of connection between the charge output type accelerometer and analyzer
The Figure 2 shows that the measurement result of the signal (124 dB, 250 Hz) of a sound calibrator (pistonphone) by connecting our measurement microphone preamplifier to DS-3000 Data station. The total sensitivity of the microphone preamplifier is about 27.6 mV/Pa.
Since the magnitude of the calibration signal is 124 dB (31.6 Pa), the calibration signal voltage is calculated to be 0.872 V in efficient value, 1.233 V in half amplitude. The maximum value of the time-axis waveform (the upper row of Fig.2) is 1.255 V.
The sound pressure signal is calculated to be 31.6 Pa in efficient value, 44.7 Pa in half amplitude. The maximum value of the time-axis waveform (the middle row of Fig.2) is 45.49 Pa. Since sound calibration is performed with this signal input, the component of the spectrum at 250 Hz and the overall value are 124 dB in the lower row.
Fig.2 The correct calibration signals |
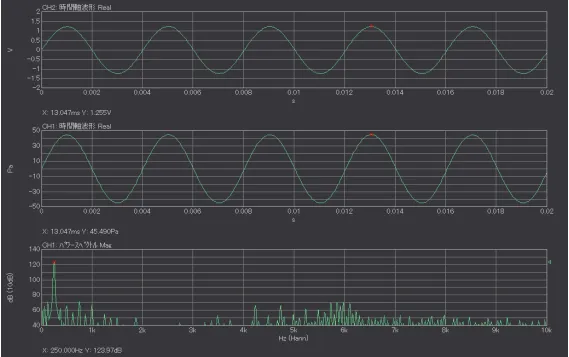
There are two types of sound calibrator, piston-phone type and dynamic speaker type. Piston-phone method generates a constant sound pressure by reciprocating piston inside the cylinder. Since sound pressure is generated by the mechanical piston movement, the harmonic components are remarkable in the power spectrum when compared to the speaker type. The 3rd component of the power spectrum is 72.2 dB at 750 Hz, the 4th component is 67.9 dB at 1,000 Hz in the lower row. The maximum value of the time axis waveform is slightly deviated from the calculated value due to the influence of such harmonic distortion, however, it is not a problem since the sound calibration is usually performed by the overall value of the power spectrum.
When turning off CCLD (constant current drive)
CCLD (constant current drive) is one of the mechanisms for supplying power to sensors and preamplifiers from analyzers. Some manufacturers call them IPC, IEPE, however, the mechanism is same. When using a preamplifier for CCLD type microphone, CCLD power is supplied from the analyzer or else.
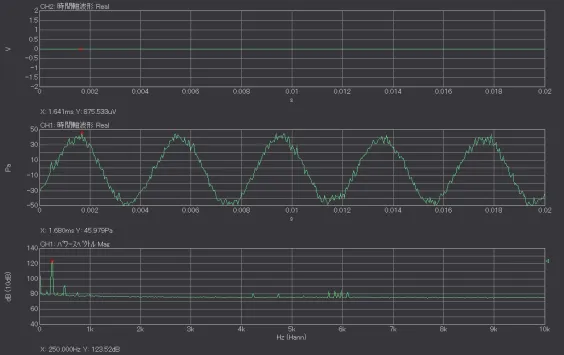
The Figure 3 shows the calibration signal measured when the CCLD power from DS-3000 is off. The maximum values of the voltage waveform (upper row) is 0.88 mV. It is very small value compared with the actual value (1.2333 V). When the vertical axis of the graph is set to auto-scale, you need to see carefully because the calibration may be performed without noticing the setting error as the similar waveform with sin-wave is displayed.
The sound pressure waveform and its power spectrum are shown in the middle and lower row of Figure 3 when sound calibration is performed in this state. Compared to Figure 2, the sound pressure waveform has noise, and the noise floor of the power spectrum is as high as 80 dB. The EU value obtained by the sound calibration should be around 0.0276 V/EU, however, the actual EU value is 0.0000178 V/EU. This indicates that the microphone sensitivity is only 0.0178 m V/Pa.
You can notice the errors when you confirm the voltage waveform before the calibration since the amplitude is abnormally small. If you perform intentionally such an incorrect calibration and understand how EU value, sound pressure waveform and power spectrum change at that time, you can notice a setting error due to an abnormal EU value or waveform.
Fig.3 The calibration signal when turning off CCLD
|
When applying an analog filter of A-weighting
The calibration signal is shown in Figure 4 when an analog filter of A-weighting is applied.
The sensitivity of the human ear is affected by frequency. A-weighting is a characteristic for measuring the amount of a human hearing. The reference value of A-weighting is 1 kHz and the correction value is -8.6 dB at 250 Hz.
If the A-weighting is applied on an analyzer, a sensor amplifier and sound level meter, etc. before performing sound calibration, EU value will be deviated by the A-weighting. The reference of frequency weighting is 1 kHz. Therefore, if the sound calibrator has 1 kHz of frequency, there is no problem. However, the correct result may not be obtained if a calibration is performed with the A-weighting when the sound calibrator of 250 Hz such as pistonphone type, or the calibrator that can switch a few frequencies is used.
Looking at the voltage waveform in the upper row of Figure 4, the maximum value, which was 1.255 V in Figure 2, became 0.37 times 0.462 V. The EU value obtained by sound calibration should be 0.0276 V/EU, however, it is as small as 0.0095 V/EU. Since the EU value become smaller by applying A-weighting, the sound pressure waveform in the middle row and the power spectrum in the lower row of Figure 4 apparently look correct waveform. Therefore, it is difficult to notice the calibration error only by the waveform of the calibration result.
If performing an actual measurement in this state, the measurement result will deviate from the previous measurement by 8.6 dB. In this case, check if the sound calibration has been performed correctly with Z-weighting (or C-weighting).
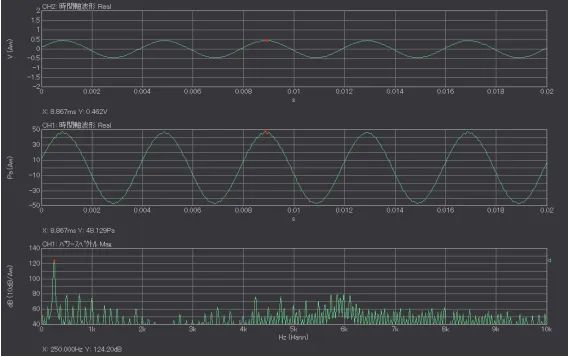
Fig.4 The calibration signal when applying A-weighting
(Upper: Voltage waveform, middle: sound pressure waveform, lower: power spectrum)
Summary
When analyzing sound signals recorded by a microphone or sound level meter with an analysis device such as FFT analyzer or data station, sound calibration is performed using a sound calibrator or REF signal (CAL signal) of sound level meter. If the settings are incorrect, a calibration signal different from a normal calibration signal will be observed.
It may be difficult to distinguish even if it is said that "it is not a normal calibration signal". Thus, we have given an example that sound calibration is performed intentionally by "wrong calibration signal" in this column.
(YK)