No.2 Measuring the frequency response function with an impulse hammer
I introduced the setting method until the trigger is applied in the hammering measurement using the impulse hammer in the previous column.
Other frequently asked questions in hammering measurements are as follows: "not obtaining natural frequency", "not obtaining the expected frequency response function", and "low coherence function". I will explain how to solve these problems in this column.
●Measuring the frequency response function with an impulse hammer
The figure 1 shows the measurement system for measuring the frequency response function with an impulse hammer.
Hit a measurement object by an impulse hammer, obtain the force signals from a hammer and the acceleration signals from an accelerometer and measure the frequency response function using them.
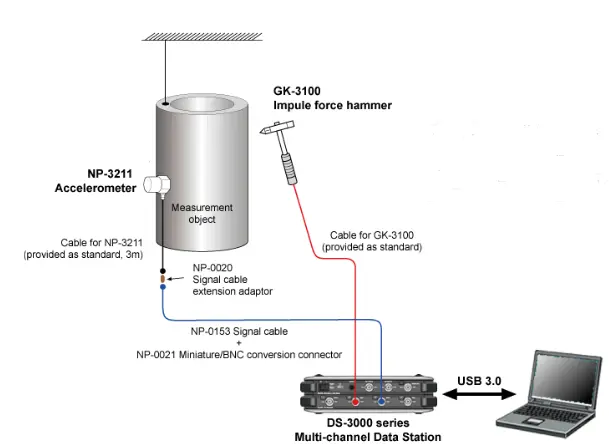
Fig.1 Time waveform (yellow: medium tip, red: super soft tip)
●A/D over and Voltage range
If the signal from the impulse hammer or accelerometer is greater than the voltage range of the analyzer, the A/D over (input over) will occur and correct results will not be obtained.
In hammering measurement, the average result is calculated by hitting multiple times. Thus, if the A/D over occurs even once, the correct result will not be obtained.
Once the A/D over occurred, the LED indicator of the input channel will turn on in red. By hitting multiple times, make sure the A/D over does not occur in any channels to adjust the voltage range. When using an impulse hammer, keep the distance between the hammer head and the object constant and hit the object with its own weight.
In addition, if a power supply unit or sensor amplifier is used between the hammer/ accelerometer and the analyzer, make sure the A/D over does not occur, neither.
If the analyzer has the A/D over cancel function and it turns ON, the data will be automatically excluded during the A/D over. By monitoring the LED indicator of the analyzer, you can notice that the hitting force was too strong and the A/D over occurred.
As for the DS-3000 series, select “Input/Output Setting” > “Sampling Condition Setting” > “A/D Over Cancel”. As for the CF-9000 series, select “Home” > “Input” > “Sample” > “Over Cancel”.
●CCLD
CCLD is an abbreviation for Constant Current Line Drive, which is a method of supplying power to the built-in preamplifier of sensor such as an impulse hammer or an accelerometer.
If the trigger is not applied, the amplitude of the power spectrum or time axis waveform is smaller than usual, or the coherence function is low, check whether you are using a CCLD type sensor or whether the CCLD setting is ON.
As for the DS-3000 series, check “Input/Output Setting” > “Input Setting”. As for the CF-9000 series, the CH information of the upper left in the main screen (Figure 2) or check “Home” > “Input” > “Input Cond”.

Fig.2 CF-9000 series channel information
●Window function
The Rectangular window is often used for hammering measurements. Exponential window or Force window are used instead, but Hanning window or Flat top window are seldom used. If the power spectrum or frequency response function does not produce the expected waveform, or if the coherence function is low, check if the window function setting is not Hanning.
●Averaging
The power spectrum sum averaging is used for hammering measurements.
After using the analyzer for other purposes, it may be in a different mode, so make sure that it is in the power spectrum summation averaging mode.
●Double hammering and coherence function
The coherence function is used to confirm if the measurement is correctly performed. The coherence functionality shows a value close to 1 when the force waveform and the vibration waveform are highly correlated. The coherence function cannot be obtained unless it is averaged two times or more.
The figure 3-1 shows the graphs of the time axis waveform, power spectrum, frequency response function, and coherence function at normal, the figure 3-2 shows them at double hammering. CH.1 is the impulse hammer and CH.2 is the accelerometer.
A double hammer is a phenomenon in which the head of the hammer hits the object more than once. In such cases, correct measurement results will not be obtained.
Looking at the time axis waveform of the CH.1 in Fig. 3-2, you can see that a double hammer has occurred. Even if the double hammer is difficult to see in the time axis waveform, it can be clearly seen by looking at the power spectrum and coherence function.
The power spectrum of the CH.1 shown Figure 3-1 is the correct one of hitting force waveform, which smoothly descends to the lower right. Due to the double hammer, the power spectrum of CH1 in Figure 3-2 is wavy, and there found a dip in the middle down to the right. In addition, the coherence function is lower than normal hitting.
When hitting wrongly like double hammer after hitting normally several times, the coherence function will suddenly get disturbed. Check the coherence function each time you hit to see changes. Alternatively, you can observe the changes by intentionally hitting twice or shifting the hitting position.
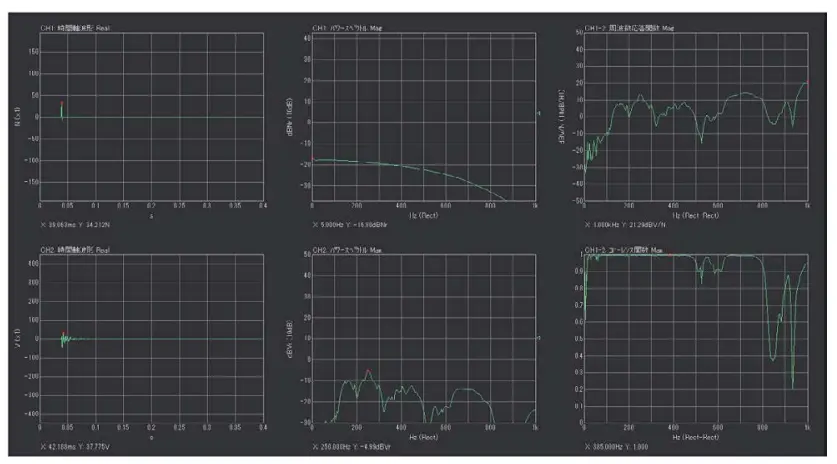
Fig.3-1 at normal hammering
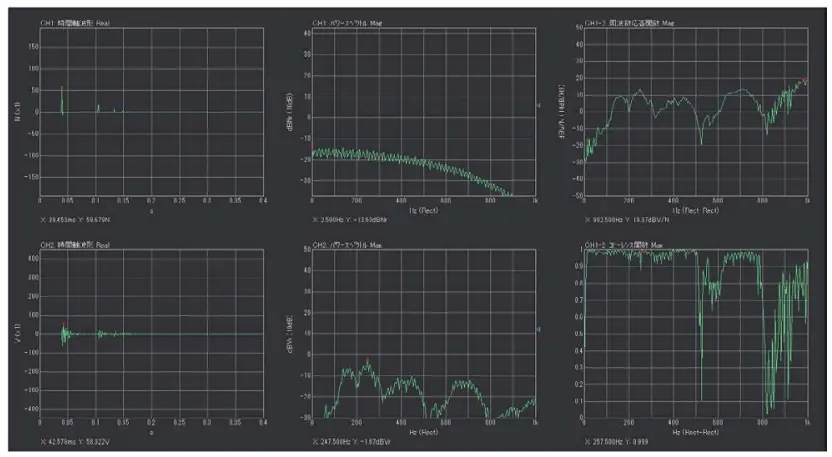
Fig.3-2 at double hammering
●Broken cable or hammer failure
If a strong signal or noise is observed in the time axis waveform when the trigger is turned off, the analyzer starts, and you touch lightly a cable or a connector, the cable may be broken. Also, if the signal magnitude is smaller than the previous result, or if the time axis waveform or power spectrum is noisy, the sensor or analyzer may be defective. It is difficult to determine whether the graph is normal, thus it is recommended to save the graph image and measurement data at the successful measurement in a file. Further, when comparing data, be sure to compare not only in the form of a graph but also in numerical values. In the case of a fault or an error in settings and connection, the value may become smaller even if the form of a graph is the same.
●Summary
In this column, I have explained some checking points when correct results cannot be obtained in the measurement of frequency response function by hammering. Before you get used to it, please check all the points. If you repeatedly have experienced to see the changes in the graph at the wrong settings and operations, double hammering, etc., you will be able to grasp the tendency of change.
(Y·K)