No.19 Sound calibration using with calibration signals (for Sound Level Meter)
When analyzing sound signals recorded by a microphone or a sound level meter using an analyzer such as an FFT analyzer or a Data station, the sound calibration is performed by a sound calibrator and a REF signal of sound level meter.
The REF signal of sound level meter and the sound calibrator have signals with a certain sound pressure level (114 dB, 94 dB, etc.). The sensitivity (mV/Pa) of a microphone or a sound level meter can be found by checking the voltage level measured by an analyzer when the signal is input. The sound calibration is performed before the measurement of sound so that you can check the operation of microphone, sound level meter, analyzer, and you can obtain sensitivity values that correct deviations in sensitivity due to secular changes and deviations in the input characteristics of the analyzer.
If sound calibration is performed with incorrect setting or without being aware of the system fault or the cable breakage, the correct measurement may not be performed even if the value displayed looks correct.
Here are a few incorrect sound calibration examples.
-Normal calibration signals
The connection example between sound level meter and analyzer is shown in Figure 1.
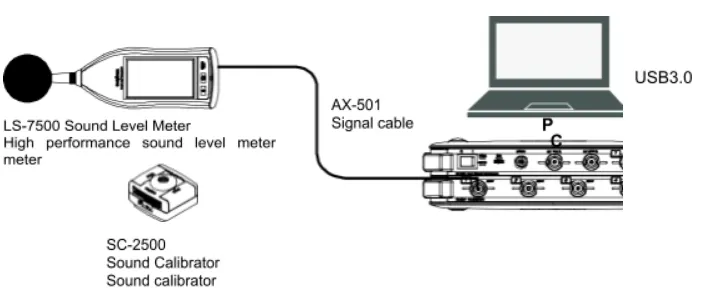
Fig.1 The connection example between sound level meter and analyzer
The calibration signal with 114 dB, 1 kHz measured when the AC-Z output of Sound level meter LA-4440 is connected to Data Station DS-3000 is shown in Figure 2.
The level range of sound level meter is 60 to 120 dB, the voltage range of DS-3000 is 1 Vms. Since the effective value 0.707 V of voltage signal is output at the maximum level range (120 dB, 20 Pa), the sensitivity of sound level meter is 0.03535 V/Pa.
Since the magnitude of the calibration signal is 114 dB (10 Pa), the voltage of calibration signal is calculated to be 0.3535 V in efficient value, 0.5 V in half amplitude. Looking at the upper row of Figure 2, the voltage signal with 0.5 V in half amplitude is observed. In the middle row, the sound pressure signal is 10 Pa in efficient value, 14.1 Pa in half amplitude. Since the calibration is performed by inputting this signal, both the power spectrum at 1 kHz of component and the overall value are 114 dB.
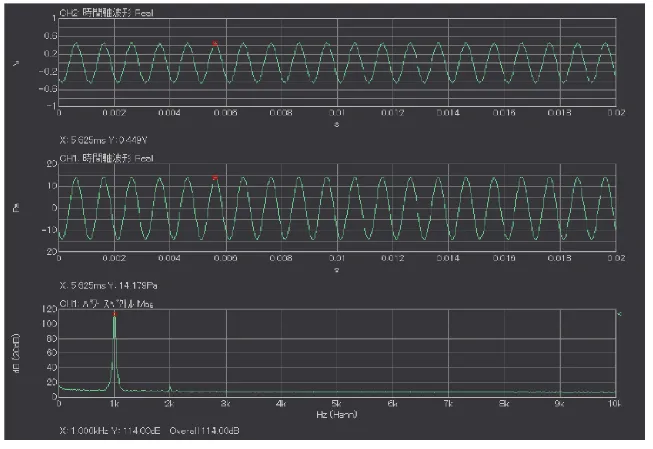
Fig.2 Correct calibration signal
(Upper: voltage waveform, middle: sound pressure waveform, lower: power spectrum)
•When the input voltage is over (1)
When the voltage range of DS-3000 is 0.316 Vrms, the calibration signals are shown in Figure 3. Since the voltage of calibration signals are 0.3535 V in effective value, 0.5 V in half-amplitude, the input over will occur in this state. The voltage waveform (upper) and the sound pressure waveform (middle) are almost sin waves. Since the calibration is performed by inputting this signal, both the power spectrum at 1 kHz of component and the overall value are 114 dB. There are peaks other than 1 kHz, which shows these are not normal signals when looking at the power spectrum. The signal level LED besides the input channels of DS-3000 Data station main unit will light up in red.
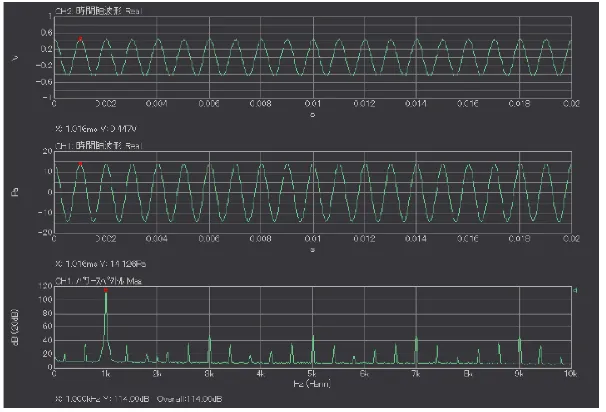
Fig.3 Calibration signal when input over (0.316 Vmrs) occurs
(Upper: voltage waveform, middle: sound pressure waveform, lower: power spectrum)
•When the input voltage is over (2)
When the voltage range of DS-3000 is 100 mVrms, the calibration signals are shown in Figure 4. The voltage waveform (upper) and the sound pressure waveform (middle) don’t have clear peak and they are not sin-waves. In addition, there are peaks other than 1 kHz, and these are not normal signals when looking at the power spectrum.
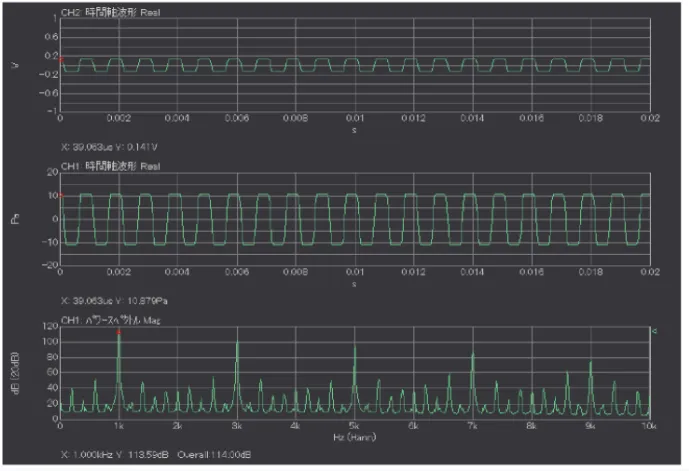
Fig.4 Calibration signal when input over (100 mVmrs) occurs
(Upper: voltage waveform, middle: sound pressure waveform, lower: power spectrum)
If the level range is not appropriate, the same waveforms appear. For example, the sound calibrator with 114 dB is used, while the level range of sound level meter is 40 to 100, or 30 to 90 dB. The analyzer doesn’t show “OV “(over) but the sound level meter does.
The piston type of sound calibrator has relatively greater distortion and the harmonic components of calibration signals are measured. If total distortion is 2.5%, the harmonic waves which is 32 dB (= 20×log10 (0.025) smaller than the calibration signals or less are measured. That is normal. To distinguish from the over input/ range is checking if the analyzer, sound level meter show “Over” or not.
•Disconnection of cable
When the cable is disconnected with a sound level meter and DS-3000, the calibration signals are shown in Figure 5. If the disconnection gap is only a little, the signals travel in the air. Thus, the time waveform and the power spectrum apparently look normal. In this data, the voltage signal is 0.368 V at half-amplitude, which is slightly less than the original value (0.5 V). If sound calibration is performed with this signal input, the sound pressure waveform and the power spectrum will show likely normal. However, in fact, the entire waveforms is slowly swinging up and down by looking at the voltage waveforms and the sound pressure waveforms. Also by looking at the power spectrum, 50 Hz, which seems to be power supply noise and its harmonics spectrum, are shown.
Such signals may be observed when the fuse in the input unit is blown or the circuit in the input section is broken due to overvoltage being applied to an analyzer such as DS-3000.
If the waveforms are not displayed at all due to the disconnection or fault, you can notice that it is abnormal. However, it may be hard to distinguish from normal waveforms if you see the waveform like this.
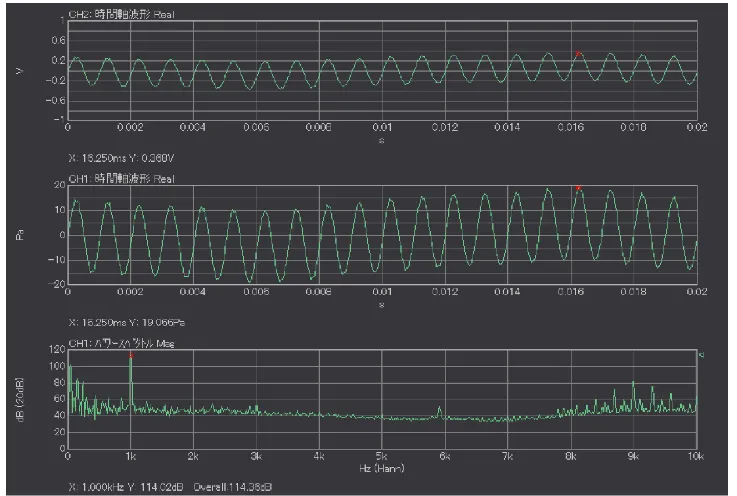
Fig.5 Calibration signal when cable disconnected
(Upper: voltage waveform, middle: sound pressure waveform, lower: power spectrum)
•Correct calibration value
There is a method to check the calibration value (V/EU value) after the calibration to confirm that the sound calibration is not performed correctly due to over voltage range/ level range, disconnection, fault or other reasons.
For products such as our Sound Level Meter that output an efficient value of 0. 707 V at the upper range, the calibration values are shown in Table 1.
If the 0 dB reference value is set to 2E-5 (20 μPa), the calibration values are shown in the third Row, and if the 0 dB reference value is set to 1, they are shown in the fourth Row.
Table 1 Relation between level range and calibration value
| Level range | Efficient value at the upper range [Pa] | Calibration value (0dB reference: 20μPa) |
Calibration value (0dB reference: 1) |
|---|---|---|---|
| 60-130 dB | 63.2 Pa | 0.01118 V/EU | 2.236E-07 |
| 50-120 dB | 20.0 Pa | 0.03535 V/EU | 7.070E-07 |
| 40-110 dB | 6.32 Pa | 0.1118 V/EU | 2.236E-06 |
| 30-100 dB | 2.00 Pa | 0.3535 V/EU | 7.070E-06 |
| 20-90 dB | 0.632 Pa | 1.118 V/EU | 2.236E-05 |
| 10-80 dB | 0.200 Pa | 3.535 V/EU | 7.070E-05 |
•Summary
When analyzing the sound signals recorded by a microphone and a sound level meter with analyzers such as FFT analyzer or Data Station, the sound calibration is performed using REF signals (CAL signals) of sound calibrator and sound level meter. If there is a misconfiguration, system fault, cable disconnection, etc., the calibration signals different from the normal ones may be observed. It may be difficult to distinguish from normal calibration signals, thus I showed you the examples which "wrong calibration signals" are intentionally generated in this column.
(Y·K)