No.15 Frequency-axis differential/integral and low frequency noise
There are various types of sensors for measuring vibration, and they are classified into displacement, velocity, and acceleration sensors according to the physical quantity. Piezoelectric accelerometers are contact-type and relatively easy to handle, but can only measure acceleration. When measuring velocity or displacement, the signals obtained from the accelerometer is converted to velocity or displacement by time-axis differential/integral or frequency-axis differential/integral with respect to the spectrum.
When acceleration signals containing DC offset and low frequency noise are converted into velocity and displacement by frequency-axis differential/integral, the value far from the reality happens to appear in the first line of the spectrum or low frequency components.
What is Frequency-axis differential/integral?
The time waveform of the acceleration signal with frequency f and half-amplitude A is shown in Equation 1. t is time.

The velocity waveform v (t) and displacement waveform x (t) can be obtained by single-integration or double-integration of the acceleration waveform as shown in Equation 2 and 3.
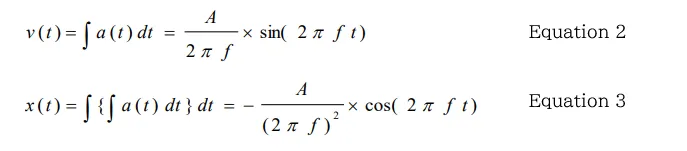
If the half-amplitude of velocity is v and the half-amplitude of displacement is x, Equation 4 and 5 are obtained from Equation 2 and 3.
When calculating the power spectrum of velocity or displacement from the power spectrum of acceleration, the frequency of each component is available, thus Equation 4 and 5 can be used to convert the acceleration value to the velocity or displacement value.
The frequency-axis differential/integral of our analyzer uses this method to convert to velocity and displacement.
DC offset
FFT analyzers convert voltage signals into digital data with an A/D converter. If the input to the analyzer is 0 V, the converted digital data should also be 0. However, the value will be off zero due to the characteristics of the analog circuit and A/D converter. This deviation is called the DC offset, which is less than 1/1000 of the voltage range in our CF-9000 series FFT analyzers and DS-3000 series Data Station.
If the DC offset is 1 mV, the analyzer shows as if 1 mV of constant signal is input. When using an accelerometer with sensitivity of 1 mV/ (m/s2), it is displayed as if the time axis waveform has constant acceleration of 1 m/s2.
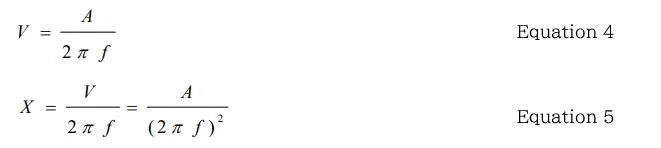
The figure 1 shows the result that constant acceleration signal of 1 m / s2 is generated and its power spectrum is obtained. It was analyzed by the frequency range of 50 Hz, the number of sampling points of 2048, and the window function of Hanning. Time length of 16 seconds and frequency resolution of 0.0625 Hz. The power spectrum was enlarged from 0 Hz to 20 Hz. The magnitude of 0 Hz component is 1 m/s2, while due to the influence of the window function (Hanning), the magnitude of 0. 0625 Hz component is 0.707 m/s2. This is not the actual acceleration, but the component due to the DC offset (error).
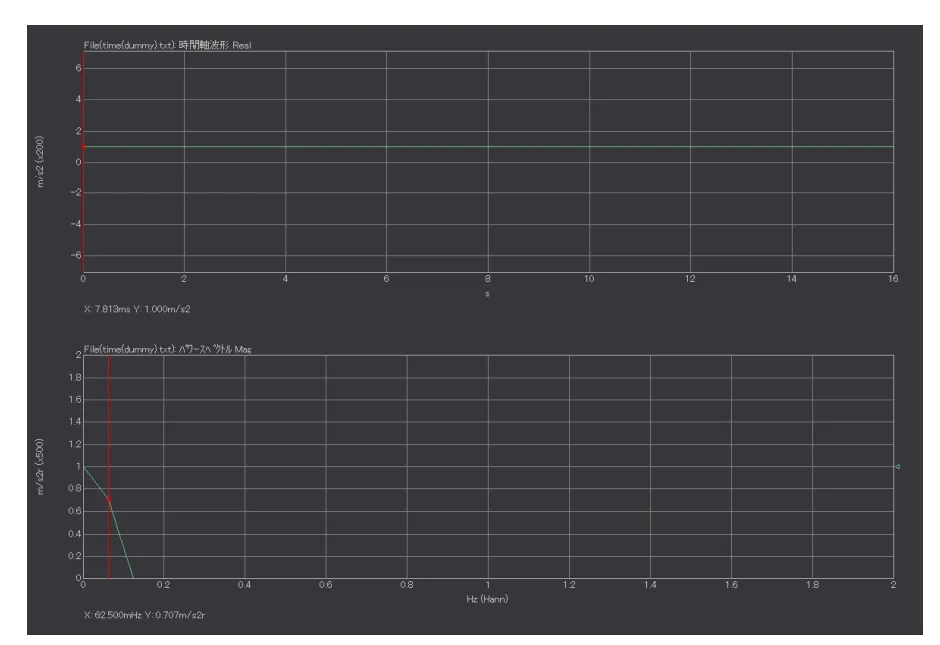
Fig.1 Time waveform with constant acceleration signal of 1 m/s2 (upper), its spectrum (lower)
The figure 2 shows that the acceleration power spectrum in the lower section (Fig.1) is converted to the power spectrum of velocity and displacement by the Frequency-axis differential/integral function. The 0 Hz component is 0 as it cannot be converted to the velocity and displacement. The magnitudes of the 0.0625 Hz component are 1.801 m/s and 4.585 m. This is not the actual velocity, displacement.
Fig.2 Power spectrum of velocity (upper), power spectrum of displacement (lower)
If an analyzer has a small DC offset (error), acceleration values that are not actually occurring will be shown. Since the conversion to velocity/ displacement by the frequency-axis differential/integral function (Equation 4 and 5) includes division by 2πf, the velocity/ displacement value of the low frequency component becomes impossibly great.
If remarkably great value of velocity/ displacement is shown in the first line of the power spectrum of velocity/ displacement integrated by the frequency-axis differential/integral function, it cannot be caused by actual vibration but can be DC offset (error) emphasized by the frequency-axis differential/integral function.
Our analyzers have DC cancel function as one of the time axis preprocessing, and by enabling this function, the effect of DC offset can be reduced. However, it cannot be completely zero.
Time waveform and spectrum for vibration acceleration of pendulum
The figure 3 shows the time waveform and power spectrum of the vibration acceleration when the accelerometer is attached sideways to the pendulum weight. It was analyzed by the frequency range of 50 Hz, the number of sampling points of 2048, time length of 16 seconds and frequency resolution of 0.0625 Hz. The power spectrum was enlarged from 0 Hz to 20 Hz.
Looking at the power spectrum, the frequency of vibration is 1.313 Hz and its magnitude is 0.199 m/s2. Since the lower range of frequency weighting of the accelerometer is 1 Hz and it is set to AC coupling, the vibration below 1 Hz cannot be measured. Therefore, the components below 0.5 Hz might be caused by the low frequency noise. The magnitude of 0.0625 Hz component of low frequency noise is 0.108 m/s2.
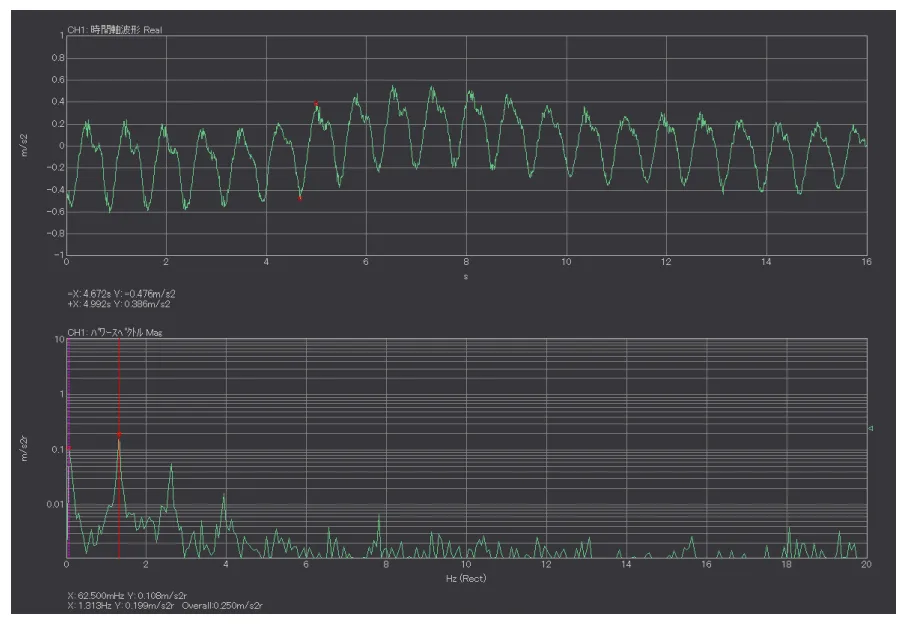
Fig 3 Time axis waveform of vibration acceleration (upper), power spectrum of displacement (lower)
The figure 4 shows the power spectrum of velocity and displacement converted from the acceleration by the Frequency-axis differential/integral function. The magnitudes of the 1.313 Hz component are 0.0242 m/s and 0.0029 m (2.9 mm), both value are appropriate. The magnitudes of the 0.0625 Hz component are 0.2761 m/s and 0.7030 m. Since the frequency components due to low frequency noise were converted into velocity and displacement by Equation 4 and 5, the values were too great for the vibration of the pendulum.
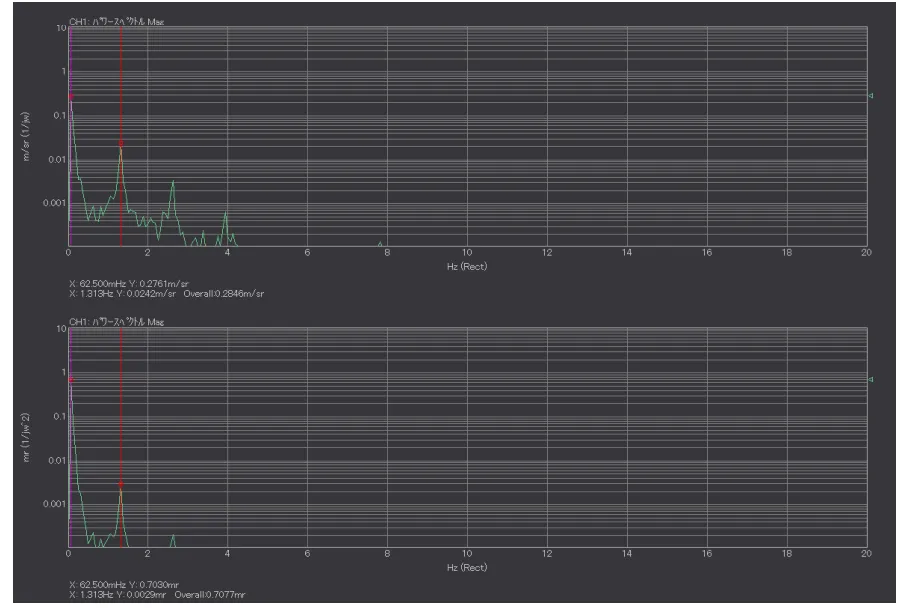
Fig 4 Power spectrum of velocity (upper), power spectrum of displacement (lower) for the pendulum
Summary
In this column, I explained about the examples that the values are shown great in the first line of the spectrum and the low frequency components, when the acceleration signals containing DC (DC) offset and low frequency noise are converted to velocity and displacement by the frequency-axis differential/integral function.
If an abnormal value is observed in velocity or displacement, turn off the frequency axis differential/integral function once, check the power spectrum of acceleration, and investigate the cause. If the cause of the abnormal velocity / displacement values is DC offset or low frequency noise, change the measurement conditions to reduce the effect, or ignore those values and evaluate the results.
(Y·K)