![]()
![]()
![]()


When the acceleration of three directions measured by the tri-axial accelerometer are X, Y and Z, the composite acceleration can be obtained with the following formula.

To obtain the power spectrum, calculate with each frequency component. When the each acceleration of X, Y and Z is measured at ch1, ch2 and ch3 at the same time, and set those power spectrum data are PWR1, PWR2 and PWR3, the composite acceleration of each frequency can be obtained with the following formula.

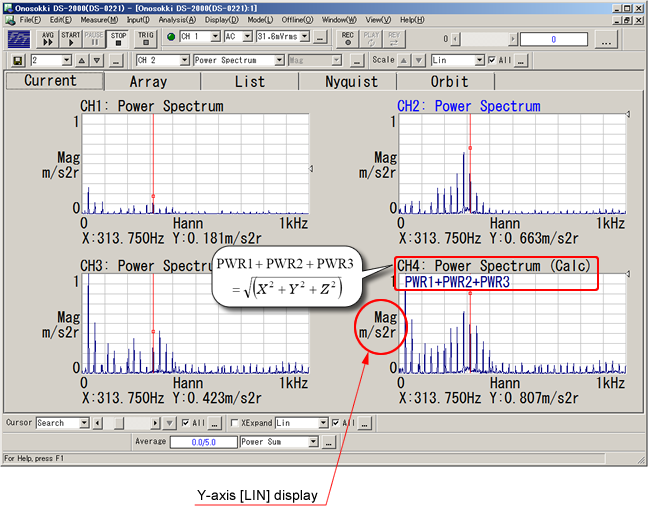
Followings are the example of 4-screen display which displays the power spectrum of ch1 (PWR1) in screen 1, power spectrum of ch2 (PWR2) in screen 2, power spectrum of ch3 (PWR3) in screen 3 and calculated composite acceleration of each frequency in screen 4.
Measurement example
1. Click [Data display > Layout setting] in this order to select 4-screen display. The upper two frames from the left are screen 1 and 2, and lower two screens from the left are screen 3 and 4.
2. The power spectrums of ch1, ch2 and ch3 (PWR1, PWR2 and PWR3) are displayed in the screen 1 to 3.
3. Activate the screen 4 by clicking the data area of it. (The data characters are changed to blue.)
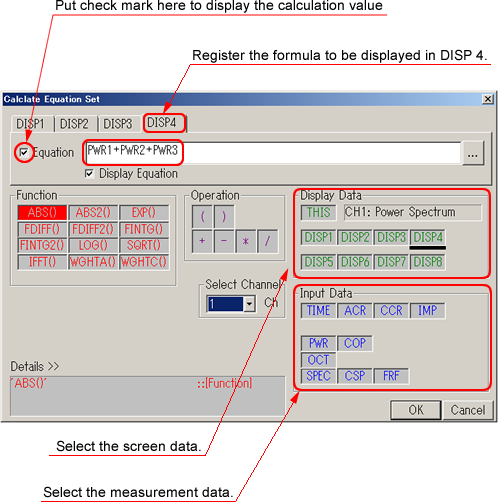
4. Click [Analysis > Calculation formula setting] in this order and input the following formula to the screen 4. Put check mark to the [Calculation] and click OK button. The calculation is executed and the results are displayed in the screen 4. Select Y-axis scale to LIN.
![]()
Calculation formula setting screen
Calculation results display
Remarks; When the data is stored data
When measure/ store the spectrum data of each axis by the single-axis accelerometer, call the power spectrum data of X, Y and Z axes to the 1, 2 and 3 screens (display frame). The calculation display is possible by executing the following calculation formula.

|
Revised:2007.04.16