Financial Report
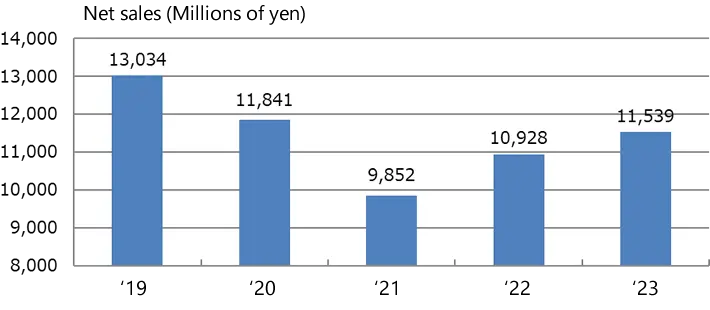
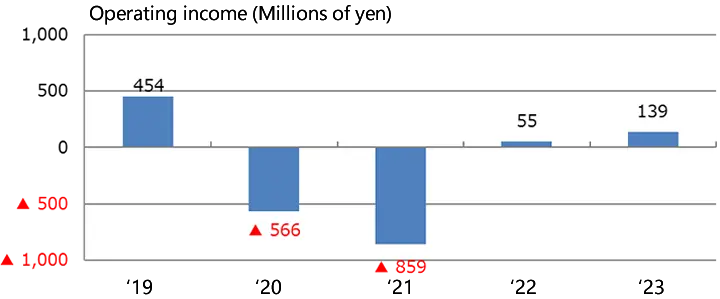
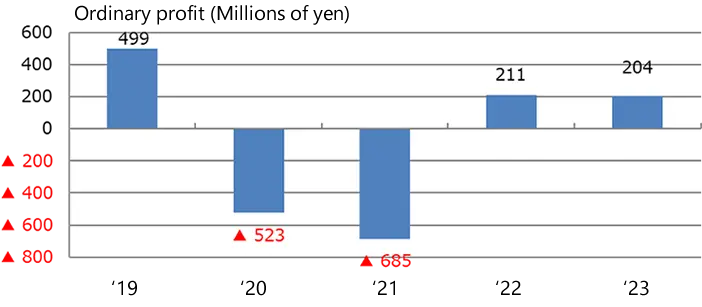
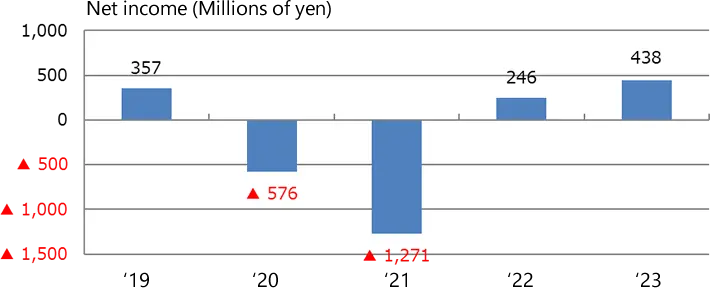
Net sales/ Profits (Consolidated)
| (Millions of yen) | ||||||||||||||||||||||||||||||
|
Net sales |
 |
Operating income |
 |
Ordinary profit |
 |
Net income attributable to owners of the patent |
 |
Profitability (Consolidated)
| (%) | ||||||||||||||||||||||||||||||
|
Operating income/Net sales/Ratio of ordinary profit to net sales /Net income/Net sales |
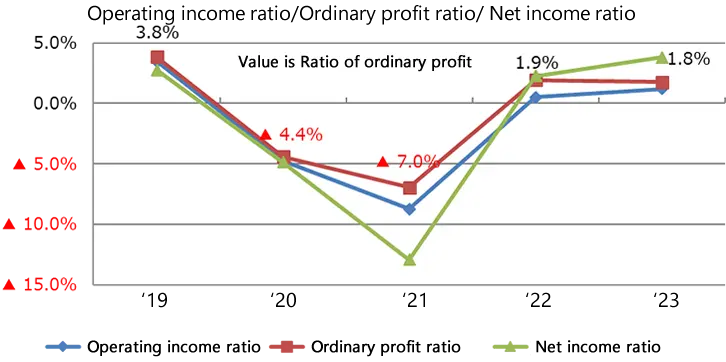 |
Return on stockholders' equity (ROE) |
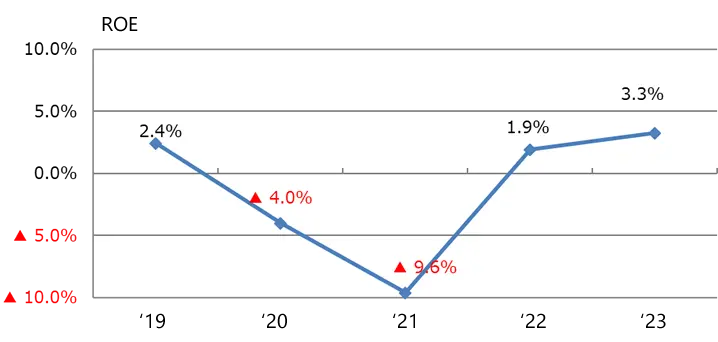 |
Capital expenditures/ Depreciation/ R&D expenses (Consolidated)
| (Millions of yen) | ||||||||||||||||||||||||
|
Capital expenditures/Depreciation/R&D expenses |
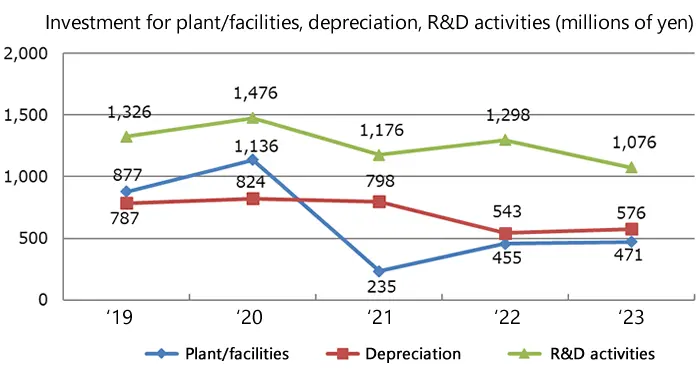 |
Update:2024/02/16