 |
|

-
If the acceleration signal is a micro voltage
signal and the signal is processed through double integration, the
DC components and extremely low-frequency components appear
relatively larger in comparison to normal signals. Therefore,
processing may result in a parabola or double integration data
rising diagonally up and to the right or falling diagonally down to
the right. Therefore, it is necessary to reduce the DC components
and extremely-low frequency components by increasing the voltage
signal when loading the signal into the FFT analyzer.
-
As the practical method, process the signals with
an analog integrator, convert displacement signals to those of
sufficiently high voltage, and load them into the FFT analyzer.
-
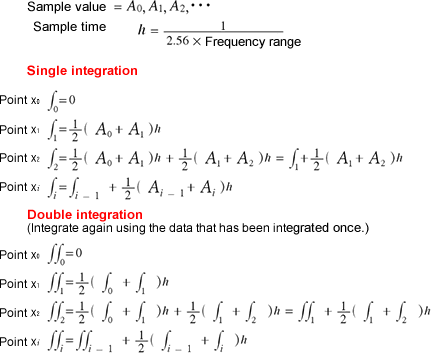
The integration calculation formula is: double
integration (integrate again the data that has been integrated).
-
In double integration, h2 is applied to the
calculation formula. Since h is a small value, the result of the
double integration will be an extremely small value.
-
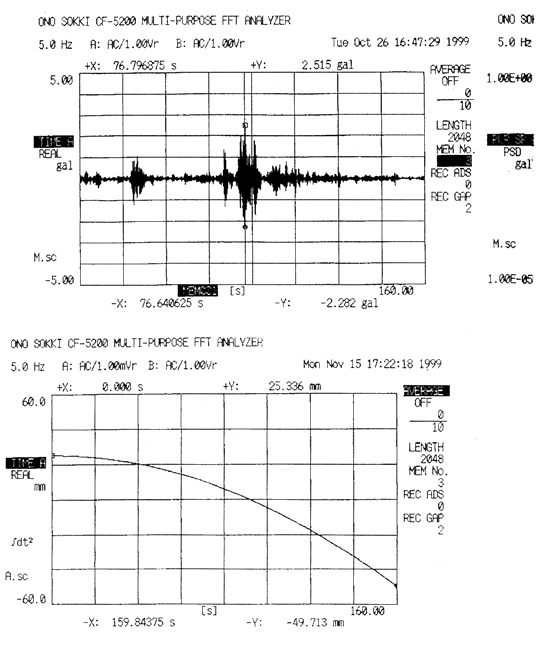
The diagram below shows the acceleration waveform
at the top and the double-integrated waveform at the bottom. The
parabola of the double integration is equivalent to the addition of
the DC component (offset) with an extremely low dose of AC
components (fluctuation).
-
Auto scale does not comply with the AC component
due to the influence of the DC component. To examine the AC
component, the scale needs to be expanded manually. However, since
an expected displacement waveform cannot be obtained from the
acceleration waveform, the situation is quite difficult. (Low
frequency after integration and DC component elimination function
are not available.)
(2005.06.20) |
|