 |
|

-
The relationship between data length (number of
sampling points), frequency range, frequency resolution, and time
waveform display length is shown in Tables 1 - 3.
|
Data length |
Table1
16384, 8192, 4096points |
Table 2
2048, 1024points |
Table 3
512, 256, 128points |
-
The CF and DS Series FFTs handle 2n sampling
patterns as one data group. The FFT analyzer display screen
therefore shows a fixed number of points. For example, with time
axis waveforms, 2048 ‘sampling point data’ is displayed.
-
With the power spectrum display, the data corresponding to ‘the
number of lines’ is displayed from 0Hz to the frequency range.
-
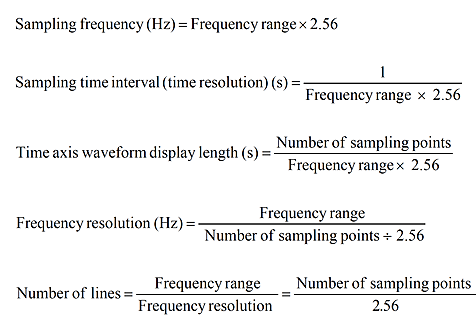
With FFT analyzers, ‘frequency range’ and ‘the number of
sampling points’ are set, and ‘frequency resolution’ and the number
of lines (the reciprocal of frequency resolution) are determined
from frequency range and the number of sampling points. With the
power spectrum, the power spectrum corresponding to the number of
the lines is displayed for each frequency resolution step. This
relationship is found with the following equations.
(2002.06.17) |
|
