Option
Viewer : O-Solution Lite
Easily check the results remotely
No license is required to use. The viewer included in O-Solution Lite shares data with an engineer in a remote location. You can complete the measurement effectively in a limited time. With the DS-5000, recording of time waveforms is available.
Platform : OS-5100
Fulfilled functions lead to efficient performance
All the processing tools before the measurement and analysis are included. A variety of editing functions such as waveform cutting, correction, and search is available.
Digital Filter : OS-0521
Find quickly the frequency band of the noise
You can quickly find the frequency band that causes noise or vibration by applying an IIR or FIR filter to the recorded data and listen to the sound. The filter applied time series data can be saved as another file.

FFT Analysis Function : OS-0522
Grasp the frequency components and resonance frequencies
The most basic function used to observe the magnitude and resonance phenomena of vibration and sound in detail with analyzing the time axis wave form for each frequency components. It enables to calculate the power spectrum, frequency response function, coherence function, and attenuation ratio etc.
Along with the FFT analysis, you can simultaneously perform the octave, tracking analysis in real time.
* For the simultaneous measurement, the Tracking analysis function (OS-0523) and Octave analysis function (OS-0524) are required.
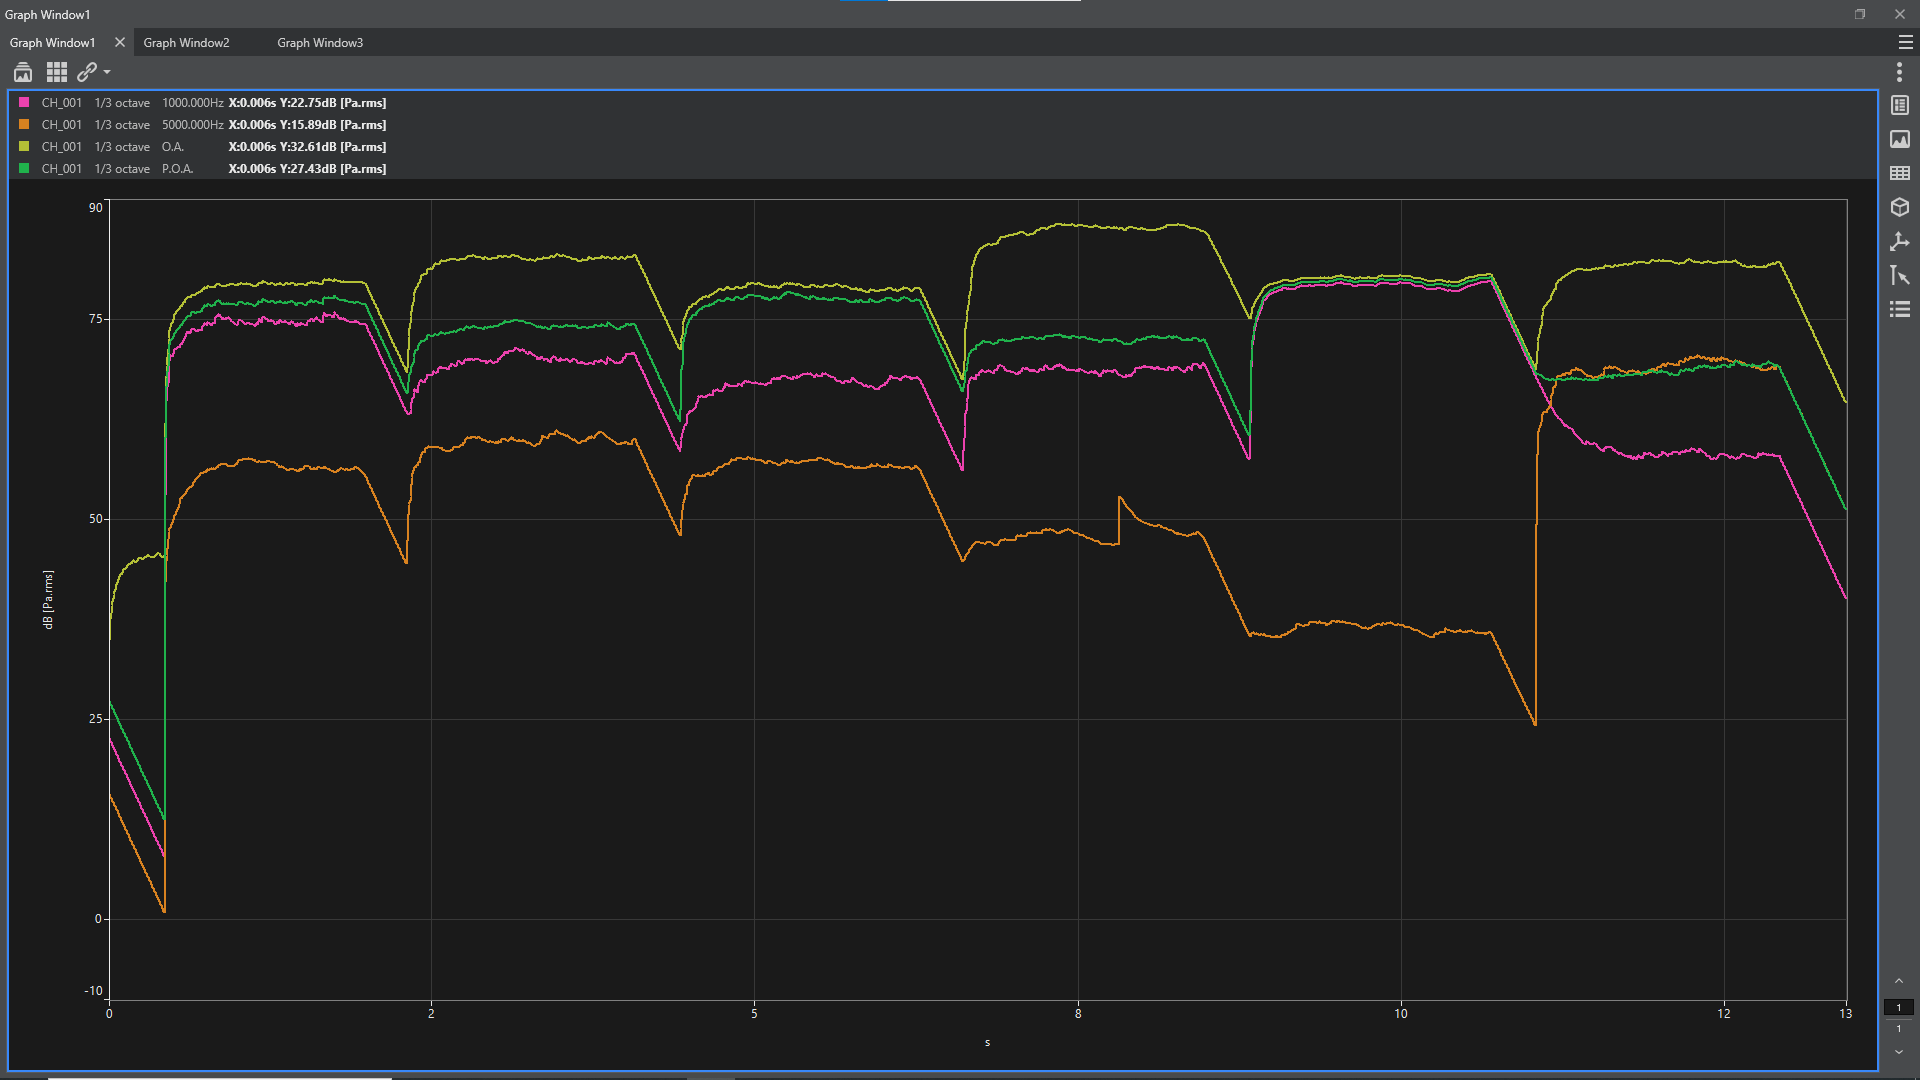
Tracking Analysis Function : OS-0523
Understand the sound and vibration characteristics of rotating object
You can understand the sound and vibration generated by rotating objects such as motors and generators, and at what rotation speed each order component becomes large.
Tracking analysis with constant ratio and constant width, and offset tracking are also available.
The tracking analysis and the FFT analysis can be performed simultaneously in real time.
* For the simultaneous measurement, the FFT analysis function (OS-0522).
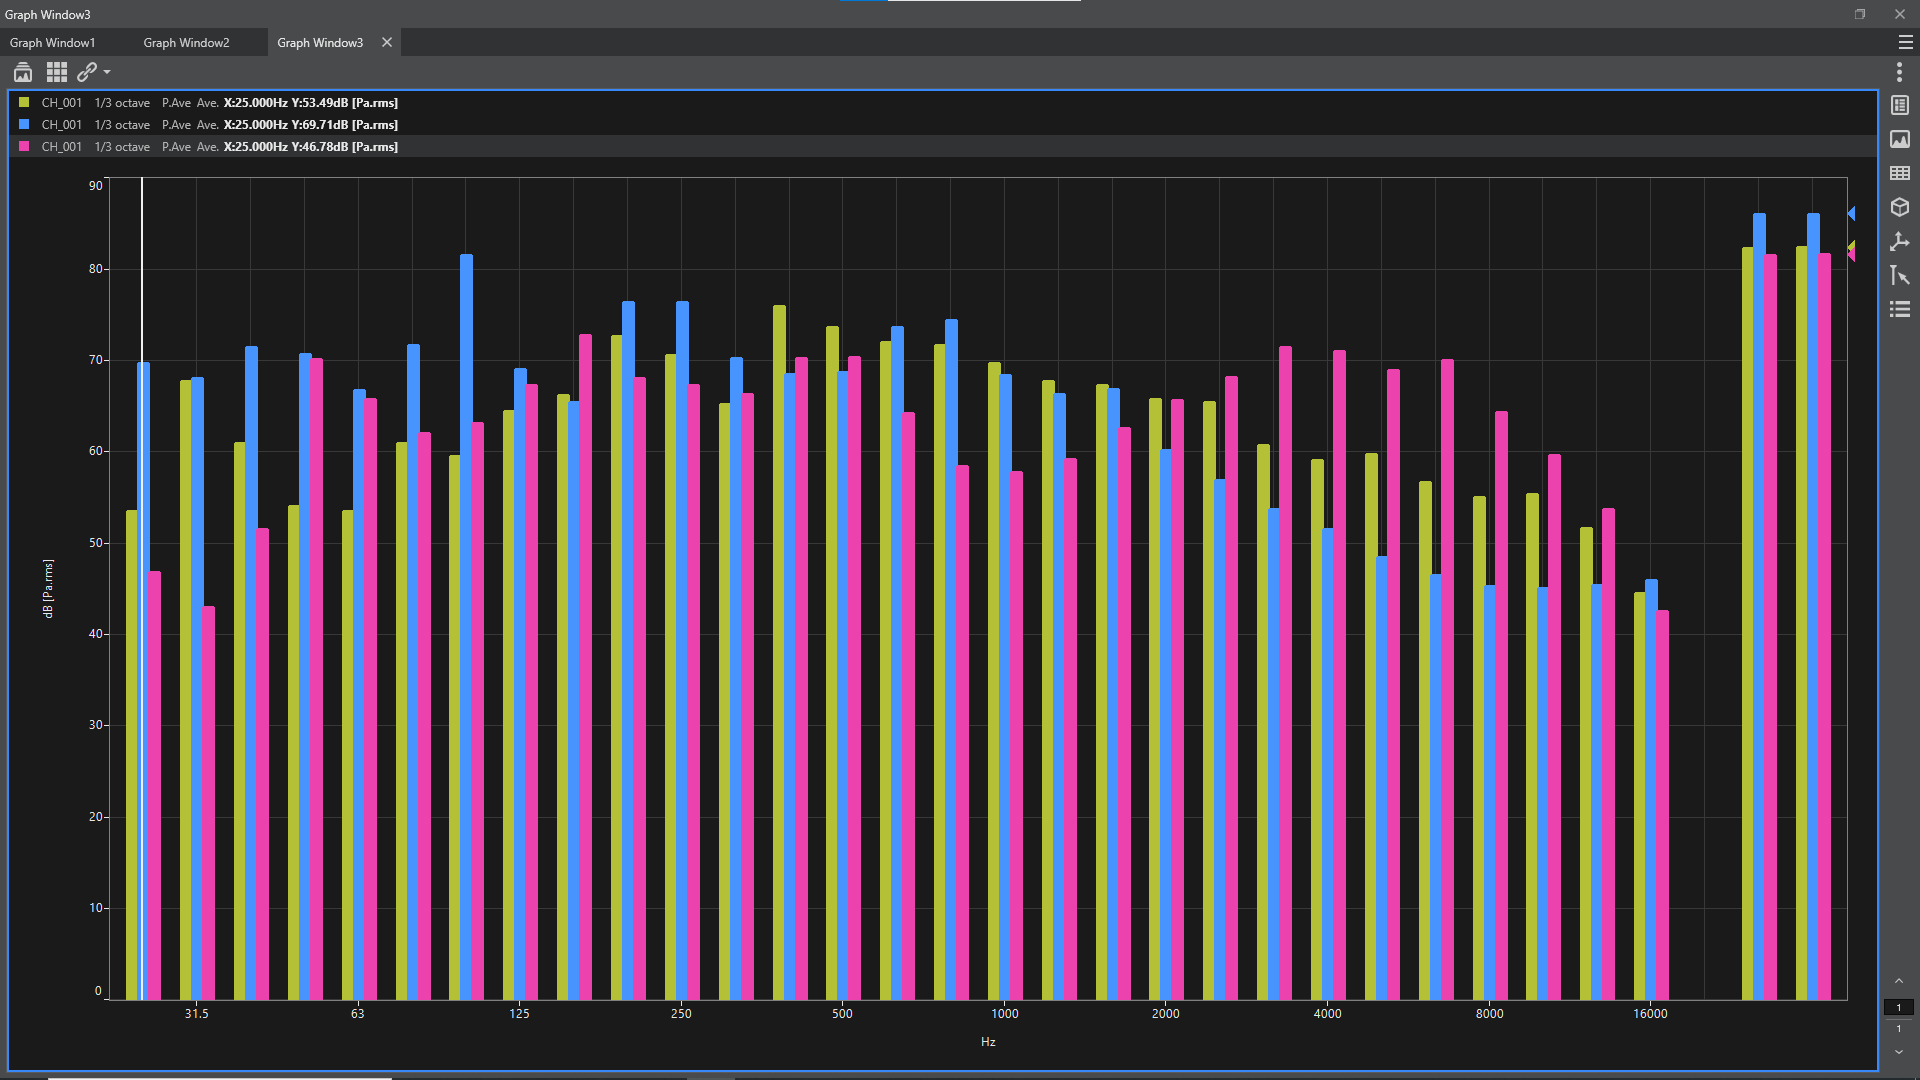
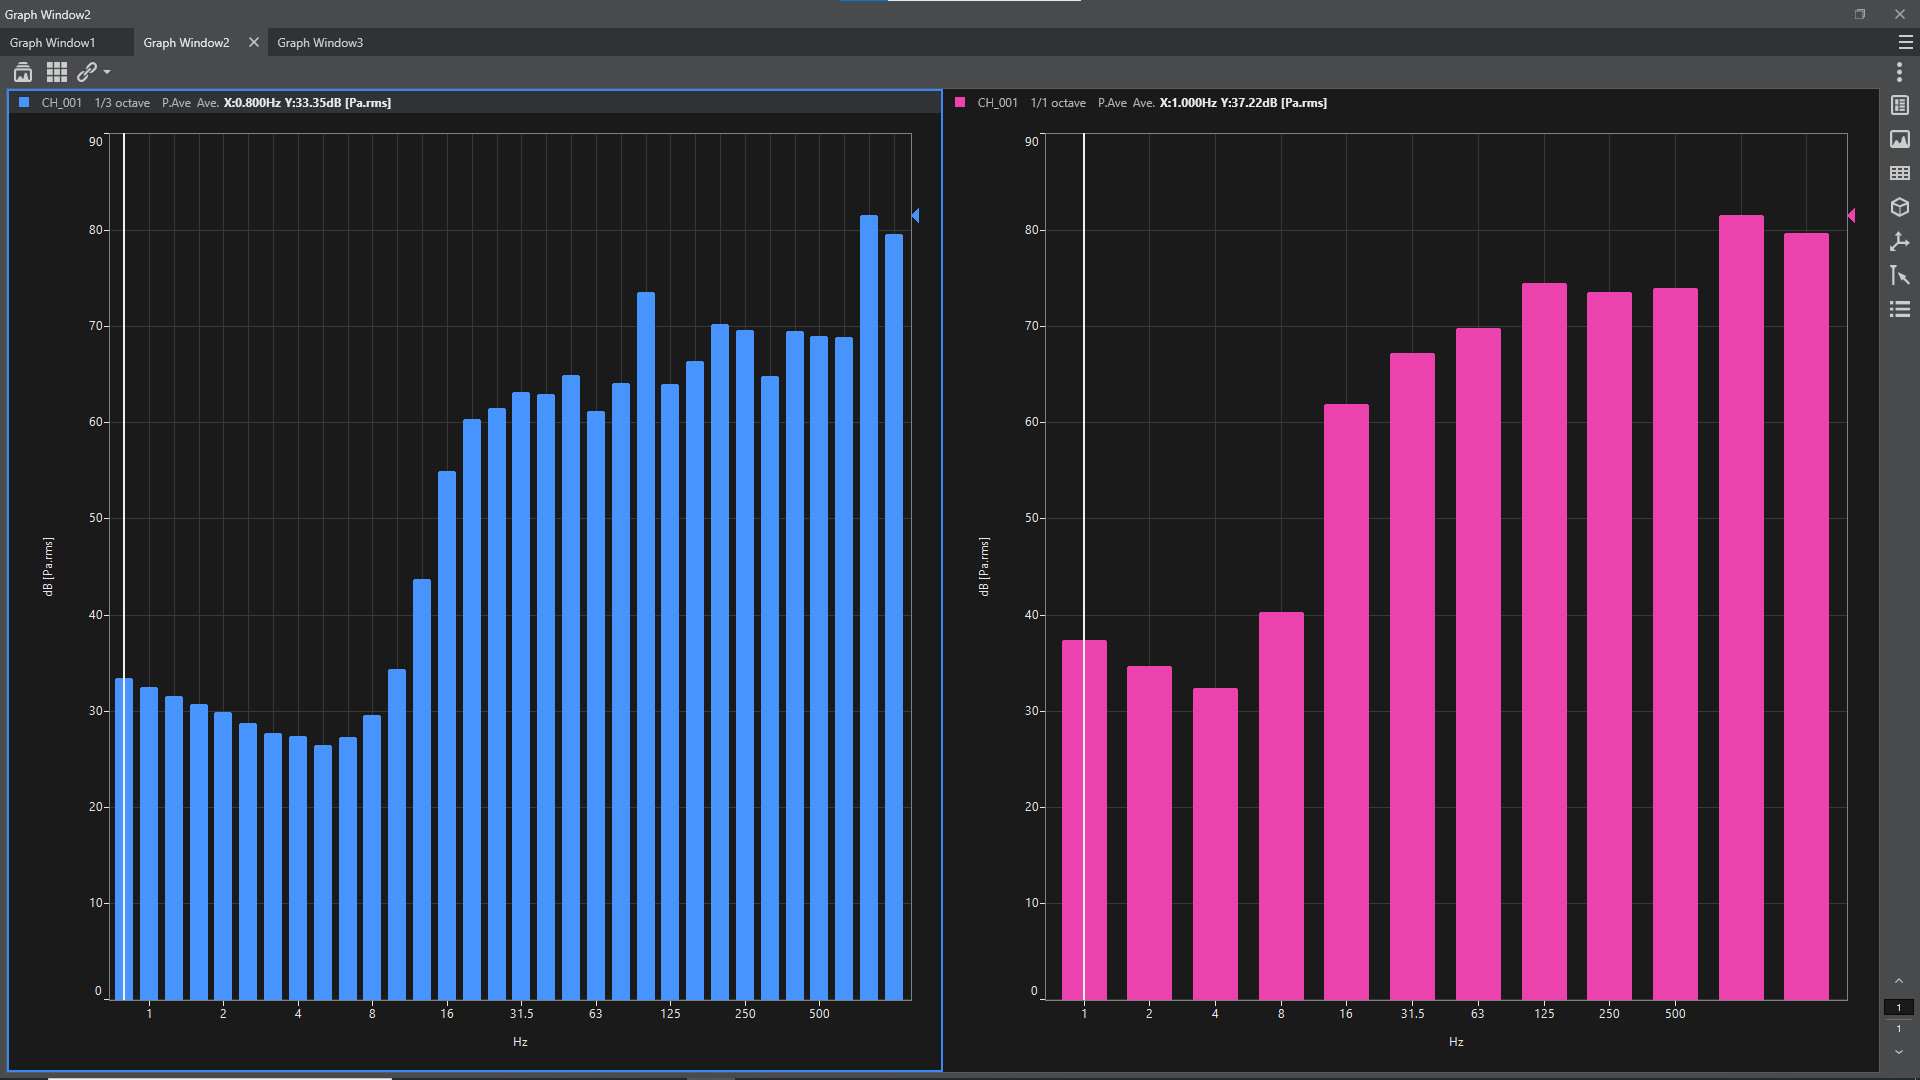
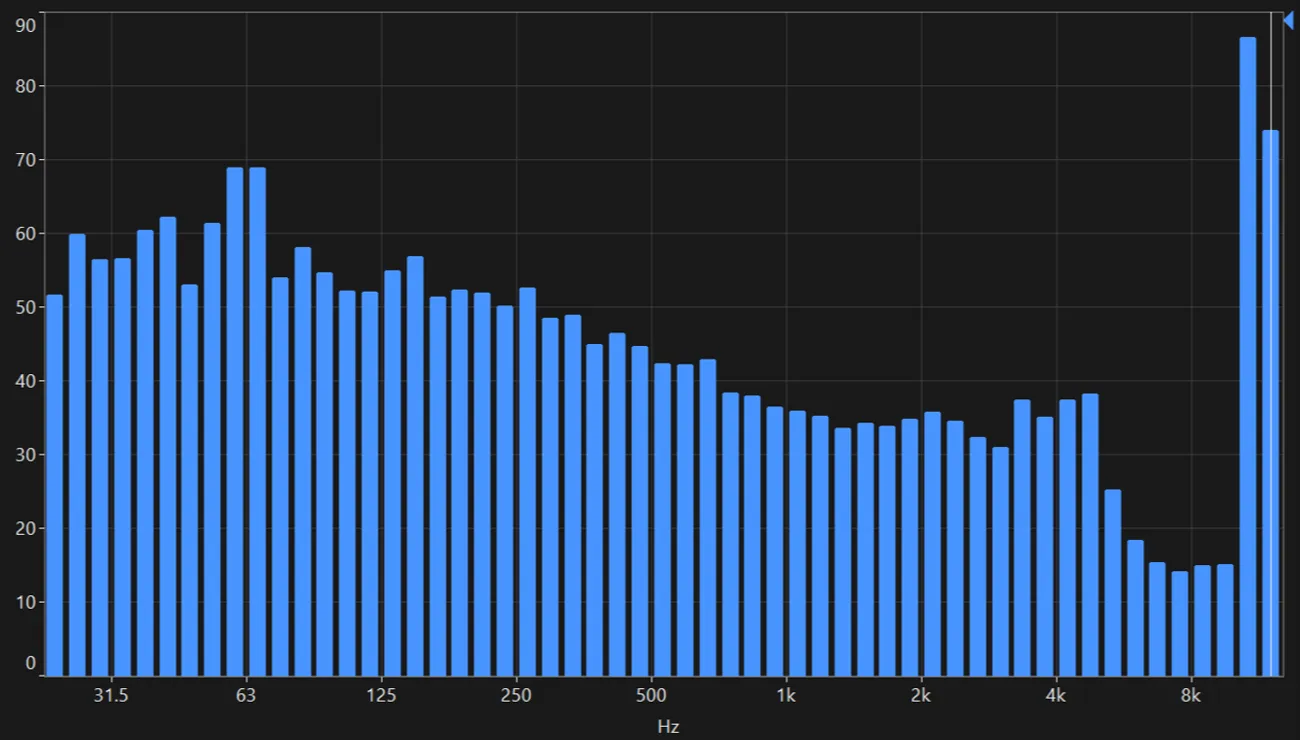
Octave Analysis Function : OS-0524
Measures environmental noise and vibration
This function is similar to the characteristics of the human ear (logarithmic (Log) to frequency) . Often used to understand noise and vibration levels and for measurements in accordance with ISO and JIS standards.
In the Multiple analyses, you can simultaneously perform the FFT analysis and Octave analysis.
In measurement mode (real time measurement), 1/1, 1/3, 1/6, 1/12, 1/16, and 1/24 octave analysis is available.
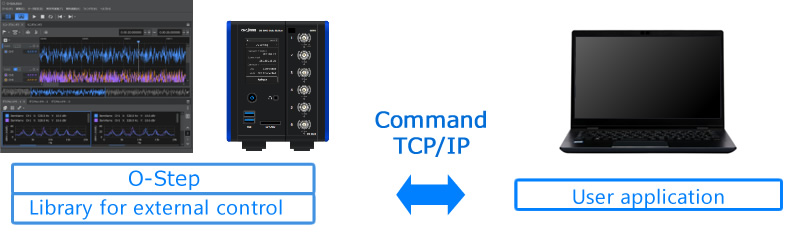
External Control Function : OS-0510
External data control of O-Solution from user’s application
Using the library for external control function (O-Step API), the O-Solution can be controlled from the user's application(*) via TCP/IP.
Sound and vibration data can be automatically imported into the user's system.
Example1 :
Automation of repetitive tasks such as sound and vibration data acquisition
You can automatically measure, analyze and save huge data.
Example2 :
Periodic and automatic NV evaluation of test equipment
*Examples
Program languages other than C# and Python will be supported shortly.
Hardware Connection: OS-0512
Perform real-time analysis
By using the OS-0512 Hardware Connection Function, FFT analysis, tracking analysis, Octave analysis are available in the measurement mode.
Sound Quality Evaluation Function : OS-0525
Sound quality evaluation considering human hearing characteristics
The sounds generated from the equipment are mainly measured by evaluation based on general analysis such as sound pressure level,
FFT analysis and 1/3 Octave analysis. However, since those analysis don’t take into consideration the human hearing characteristics enough,
sounds with even the same analysis result may give different impression.
When a human listens to a sound, various sensations such as loudness, sharpness, and roughness occur.
This function enables to obtain sound quality evaluation indicators that take into consideration the human hearing characteristics and correspond to various sensations of sound.
Fluctuation Sound Analysis Function :OS-0526
Evaluate the temporally fluctuating sounds
Although the magnitude of sound is not so large, there are many “unpleasant sounds” in the world. For example, “rattling” and “humming“ sounds generated from interior parts while driving a car, or abnormal sounds such as “buzzing“ sounds that can be heard in the rotation sound of a small motor, etc. Sounds with significant temporal fluctuations often feel unpleasant even if the magnitude of sound(level) is not so large. The Fluctuation Sound Analysis Function enables to extract only the components with large temporal fluctuations that are not affected by the level. As a result, it can quantify the characteristics of various temporal fluctuations that were difficult to detect with roughness or fluctuation strength. In addition, it is equipped with a function to compare the sound with fluctuation and the sound without fluctuation. (Fluctuation sound simulator)
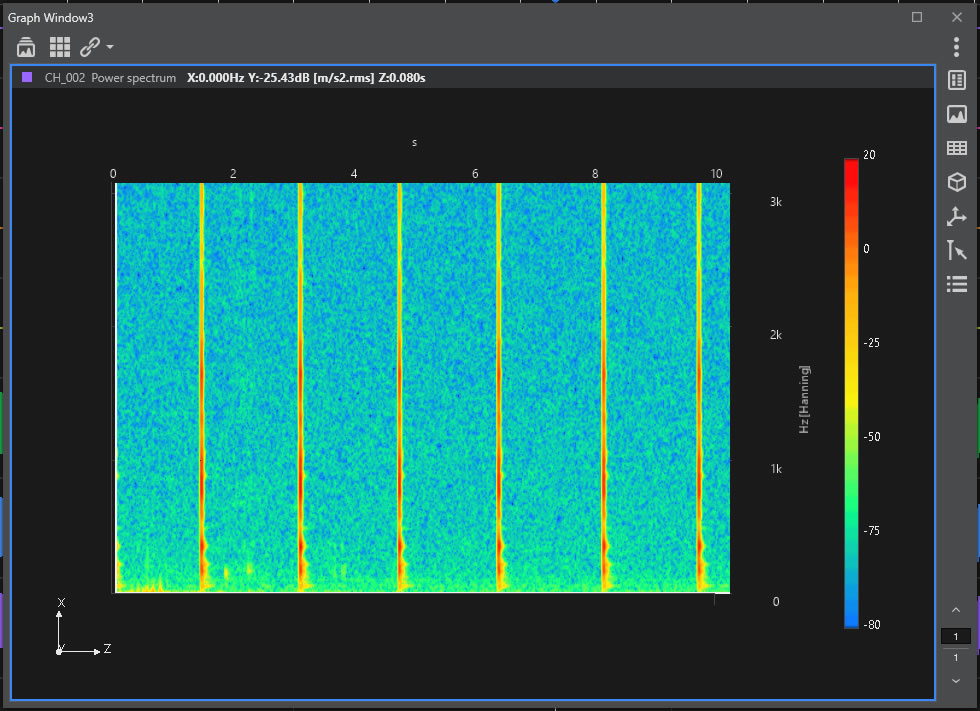
Time Frequency Analysis Function :OS-0527
Evaluate transient phenomena
This function can evaluate transient phenomena that were difficult to capture by FFT analysis and display clearly time change of the frequency components while maintaining its frequency resolution. It is equipped with STFT (Short Time Fourier Transform) and Wavelet transform.