
Financial Report
Net sales / Profits (Consolidated)
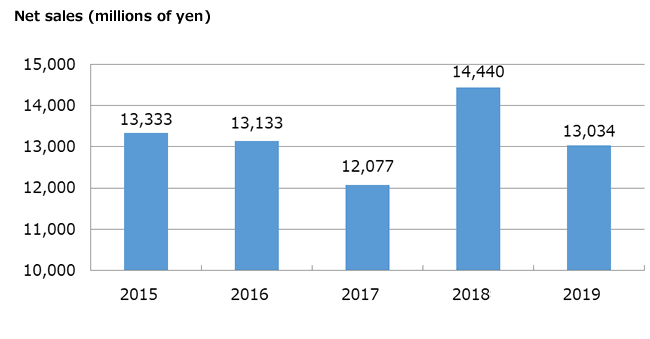
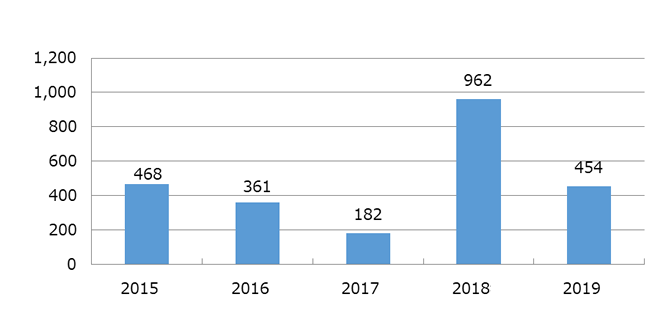
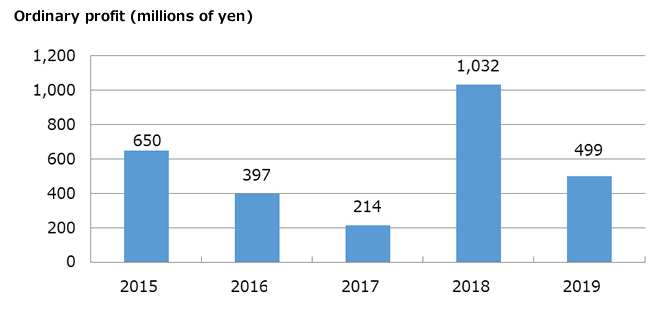
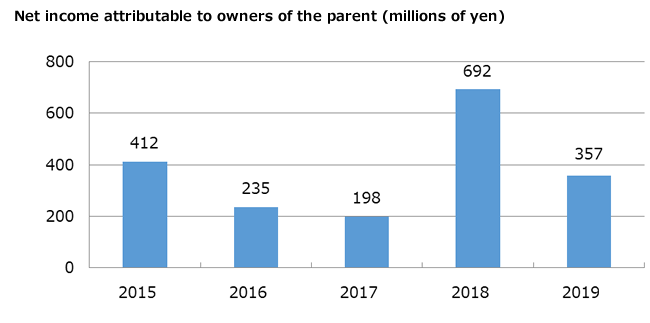
| (Millions of yen) |
| FY2014 | FY2015 | FY2016 | FY2017 | FY2018 | FY2019 | |
| Net sales | 12,449 | 13,333 | 13,133 | 12,077 | 14,440 | 13,034 |
| Operating income (loss) | 1,088 | 468 | 361 | 182 | 962 | 454 |
| Ordinary profit (loss) | 1,121 | 650 | 397 | 214 | 1032 | 499 |
| Net income attributable to owners of the parent (loss) |
1,196 | 412 | 235 | 198 | 692 | 357 |
| Net sales |
 |
| Operating income |
 |
| Ordinary profit |
 |
| Net income attributable to owners of the parent |
 |
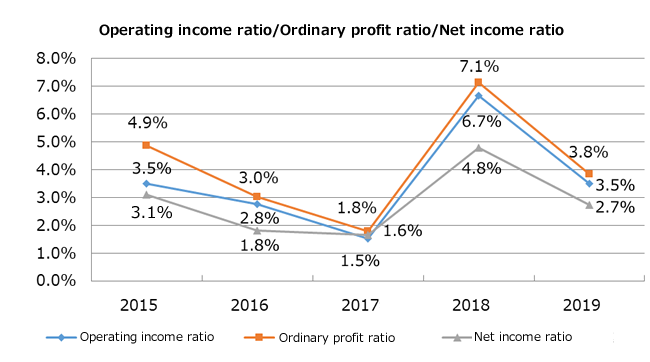
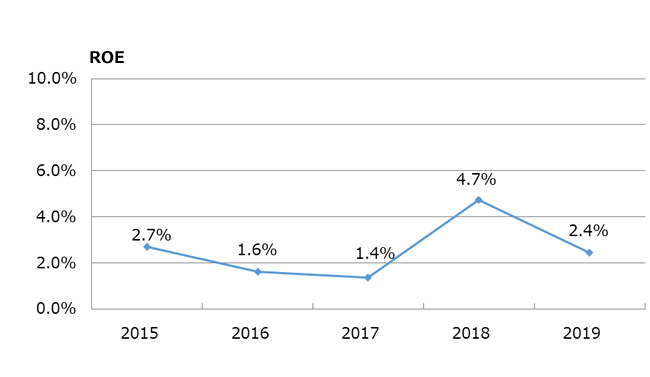
- Operating income ratio / Ordinary profit ratio / Net income ratio /ROE (Consolidated)
| (percent) |
| FY2015 | FY2016 | FY2017 | FY2018 | FY2019 | |
| Operating income ratio (loss) | 3.5 | 2.8 | 1.5 | 6.7 | 3.5 |
| Ordinary profit ratio (loss) | 4.9 | 3.0 | 1.8 | 7.1 | 3.8 |
| Net income ratio (loss) | 3.1 | 1.8 | 1.6 | 4.8 | 2.7 |
| ROE (loss) | 2.7 | 1.6 | 1.4 | 4.7 | 2.4 |
| Operating income ratio / Ordinary profit ratio / Net income ratio |
 |
| ROE |
 |
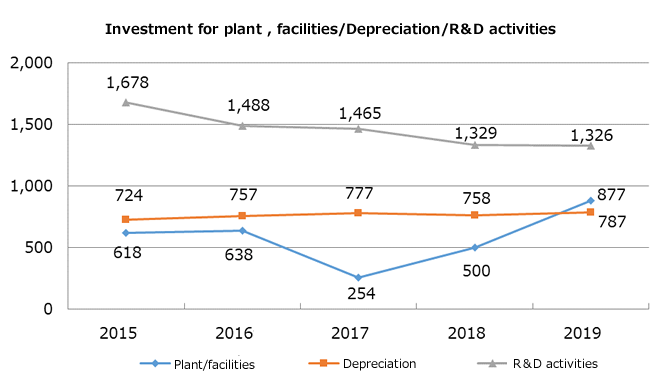
- Investment for plant / facilities, depreciation, R&D activities (Consolidated)
| (Millions of yen) |
| FY2014 | FY2015 | FY2016 | FY2017 | FY2018 | FY2019 | |
| Plant / facilities | 1,941 | 618 | 638 | 254 | 500 | 877 |
| Depreciation | 487 | 724 | 757 | 777 | 758 | 787 |
| R&D activities | 1,446 | 1,678 | 1,488 | 1,465 | 1,329 | 1,326 |
| Investment for plant/facilities, depreciation, R&D activities |
 |