Tracking Analysis Software
DS-0222
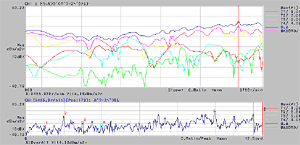
Example of rotation-tracking diagram of engine vibration
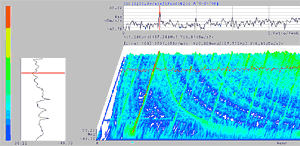
Example of data output by 3D mapping
This software enables tracking analysis with high-speed (calculation speed: approx. at 20msec/4-ch), high-resolution (maximum at 1000 blocks) and high-accuracy (more than 100dB dynamic range). Each model has V, W and X at the end of model name according to its number of channels. DS-0222V is available for 2-ch, DS-0222W is for 4 to 8-ch, and DS-0222X is for 10 to 32-ch.
It can plot rotation-tracking diagram during calculation, and also can set and plot the diagram of intended order or frequency after calculation. If you file a 3D display data, you can read the file in order to plot its rotation-tracking diagram later. Also, campbell plot can be plotted as an option. Windows (Windows 2000/XP/VISTA) is applicable as an operating system.
*DS-0221 FFT analysis software is required to perform tracking analysis.
What is Tracking analysis
Rotational machines such as engines or compressors etc. are rotating with wide range of rotational speed from low to high speed. For those rotational machines, resonance between rotational speed and natural frequency of each component (rotational shaft, gear, bracket etc.) of rotational machine may be causing serious problem. As an example of torsional vibration including large generator, resonance may generate excitation energy lager than allowable stress, and therefore it causes serious accident to destruction. Rotation-tracking analysis helps greatly to observe the cause such as which component or order of rotational speed makes noise and vibration when a rotational machine makes vibration with certain rotational speed. As shown in the below, rotation-spectrum diagram (3D spectrum) figures out the change of frequency (order) spectrum respect to the change of rotational speed. In comparison, rotation-tracking analysis (order tracking analysis) shows that how much noise and vibration are generated from which order of rotational component with two-dimensional graph.
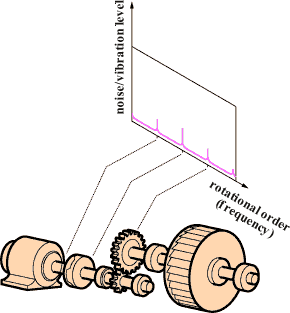
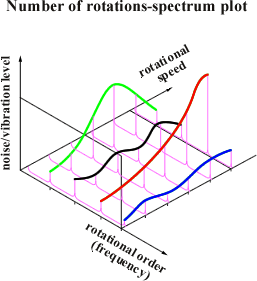
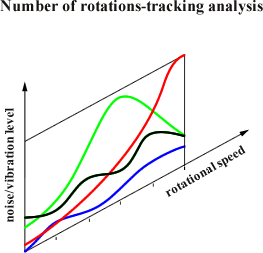
*Rotational order is defined that a based rotational speed is 1-order, n-times rotational component is n-order. Data analysis with order on the X axis and amplitude on the Y axis is called rotational order ratio analysis. Rotational order ratio analysis requires rotational signal information.
Specifications
(1)Rotational pulse input
| Number of input pulses | 0.5 to 1024 pulse/1 rotation |
|---|---|
| Input impedance | 100 kΩ |
| Input coupling | DC or AC (0.5 Hz / -3dB) Voltage fullscale : TTL or ±10V |
| Slice level | ±100% within voltage fullscale Minimum input level: ±0.5V |
| Slope | +/- selectable |
(2)Analysis section
Tracking analysis |
Memory tracking (real-time plotting is possible )
Number of memory blocks : 200 to 1000 |
|||||||||||||||||||||||||||
|---|---|---|---|---|---|---|---|---|---|---|---|---|---|---|---|---|---|---|---|---|---|---|---|---|---|---|---|---|
| Maximum analysis orders | 6.25 to 800 orders | |||||||||||||||||||||||||||
| Number of sampling points | Initial setting value 2048 (maximum at 16384)
Order resolution: initial setting 800 lines (maximum at 6400 lines) Rang of measurable rotational speed (at 1P/R) |
|||||||||||||||||||||||||||
| Range of rotational speed under measurement (at 1P/R) |
|
|||||||||||||||||||||||||||
| Display function | Time-axis waveform, Frequency analysis (amplitude, phase), Order-ratio analysis (amplitude, phase), Constant-ratio tracking analysis (amplitude, phase), Constant-width tracking analysis (amplitude, phase), Fixed frequency tracking analysis (amplitude, phase), Time tracking analysis (amplitude, phase), 3D mapping , Campbell plot ( optional DS-0244) | |||||||||||||||||||||||||||
| Processing function | Exponential averaging, Maximum amplitude order tracking, Partial overall tracking, Smoothing processing (2 types), Averaging function of tracking analysis data |
(3)Input, Output function of data
| Data file | Open/Save at binary or text (.txt) format |
|---|---|
| Tracking data | Open/Save at binary format, save only at text (.txt) format |
| 3D mapping | Open/Save at binary format |
| Analysis condition file | Open/Save of arbitrary measurement condition file |
| Print function of data | Print function by installing of printer driver |
| Copy function of data | Pasting data on clipboard at text or bitmap format. |
Applications for tracking analysis
Applications
Noise/Vibration analysis for automobile engine
Noise analysis for turbo charger
Measurement of transmittance error for transmission
Torsional vibration analysis for deferential gear
Vibration analysis for turbine blade
Mode circle (directional vector display) analysis for large generator
Noise analysis for motorcycle
Revised:2006/09/19
